Make decisions from live operational data instead of guessing what happened last week.
See it in action
Reporting only helps if it reflects the way the business actually runs. Service Opus pulls analytics directly from the same customer, lead, schedule, job, inventory, invoice, and employee records your team is already using. That means reporting stays closer to the workflow instead of becoming a separate spreadsheet project at the end of the month.
Business Needs It Solves
Operational clarity: Owners and managers need a live picture of pipeline, workload, utilization, receivables, and job flow.
Smarter growth decisions: Teams need to know which lead sources, quote behaviors, customers, and technicians are producing the best outcomes.
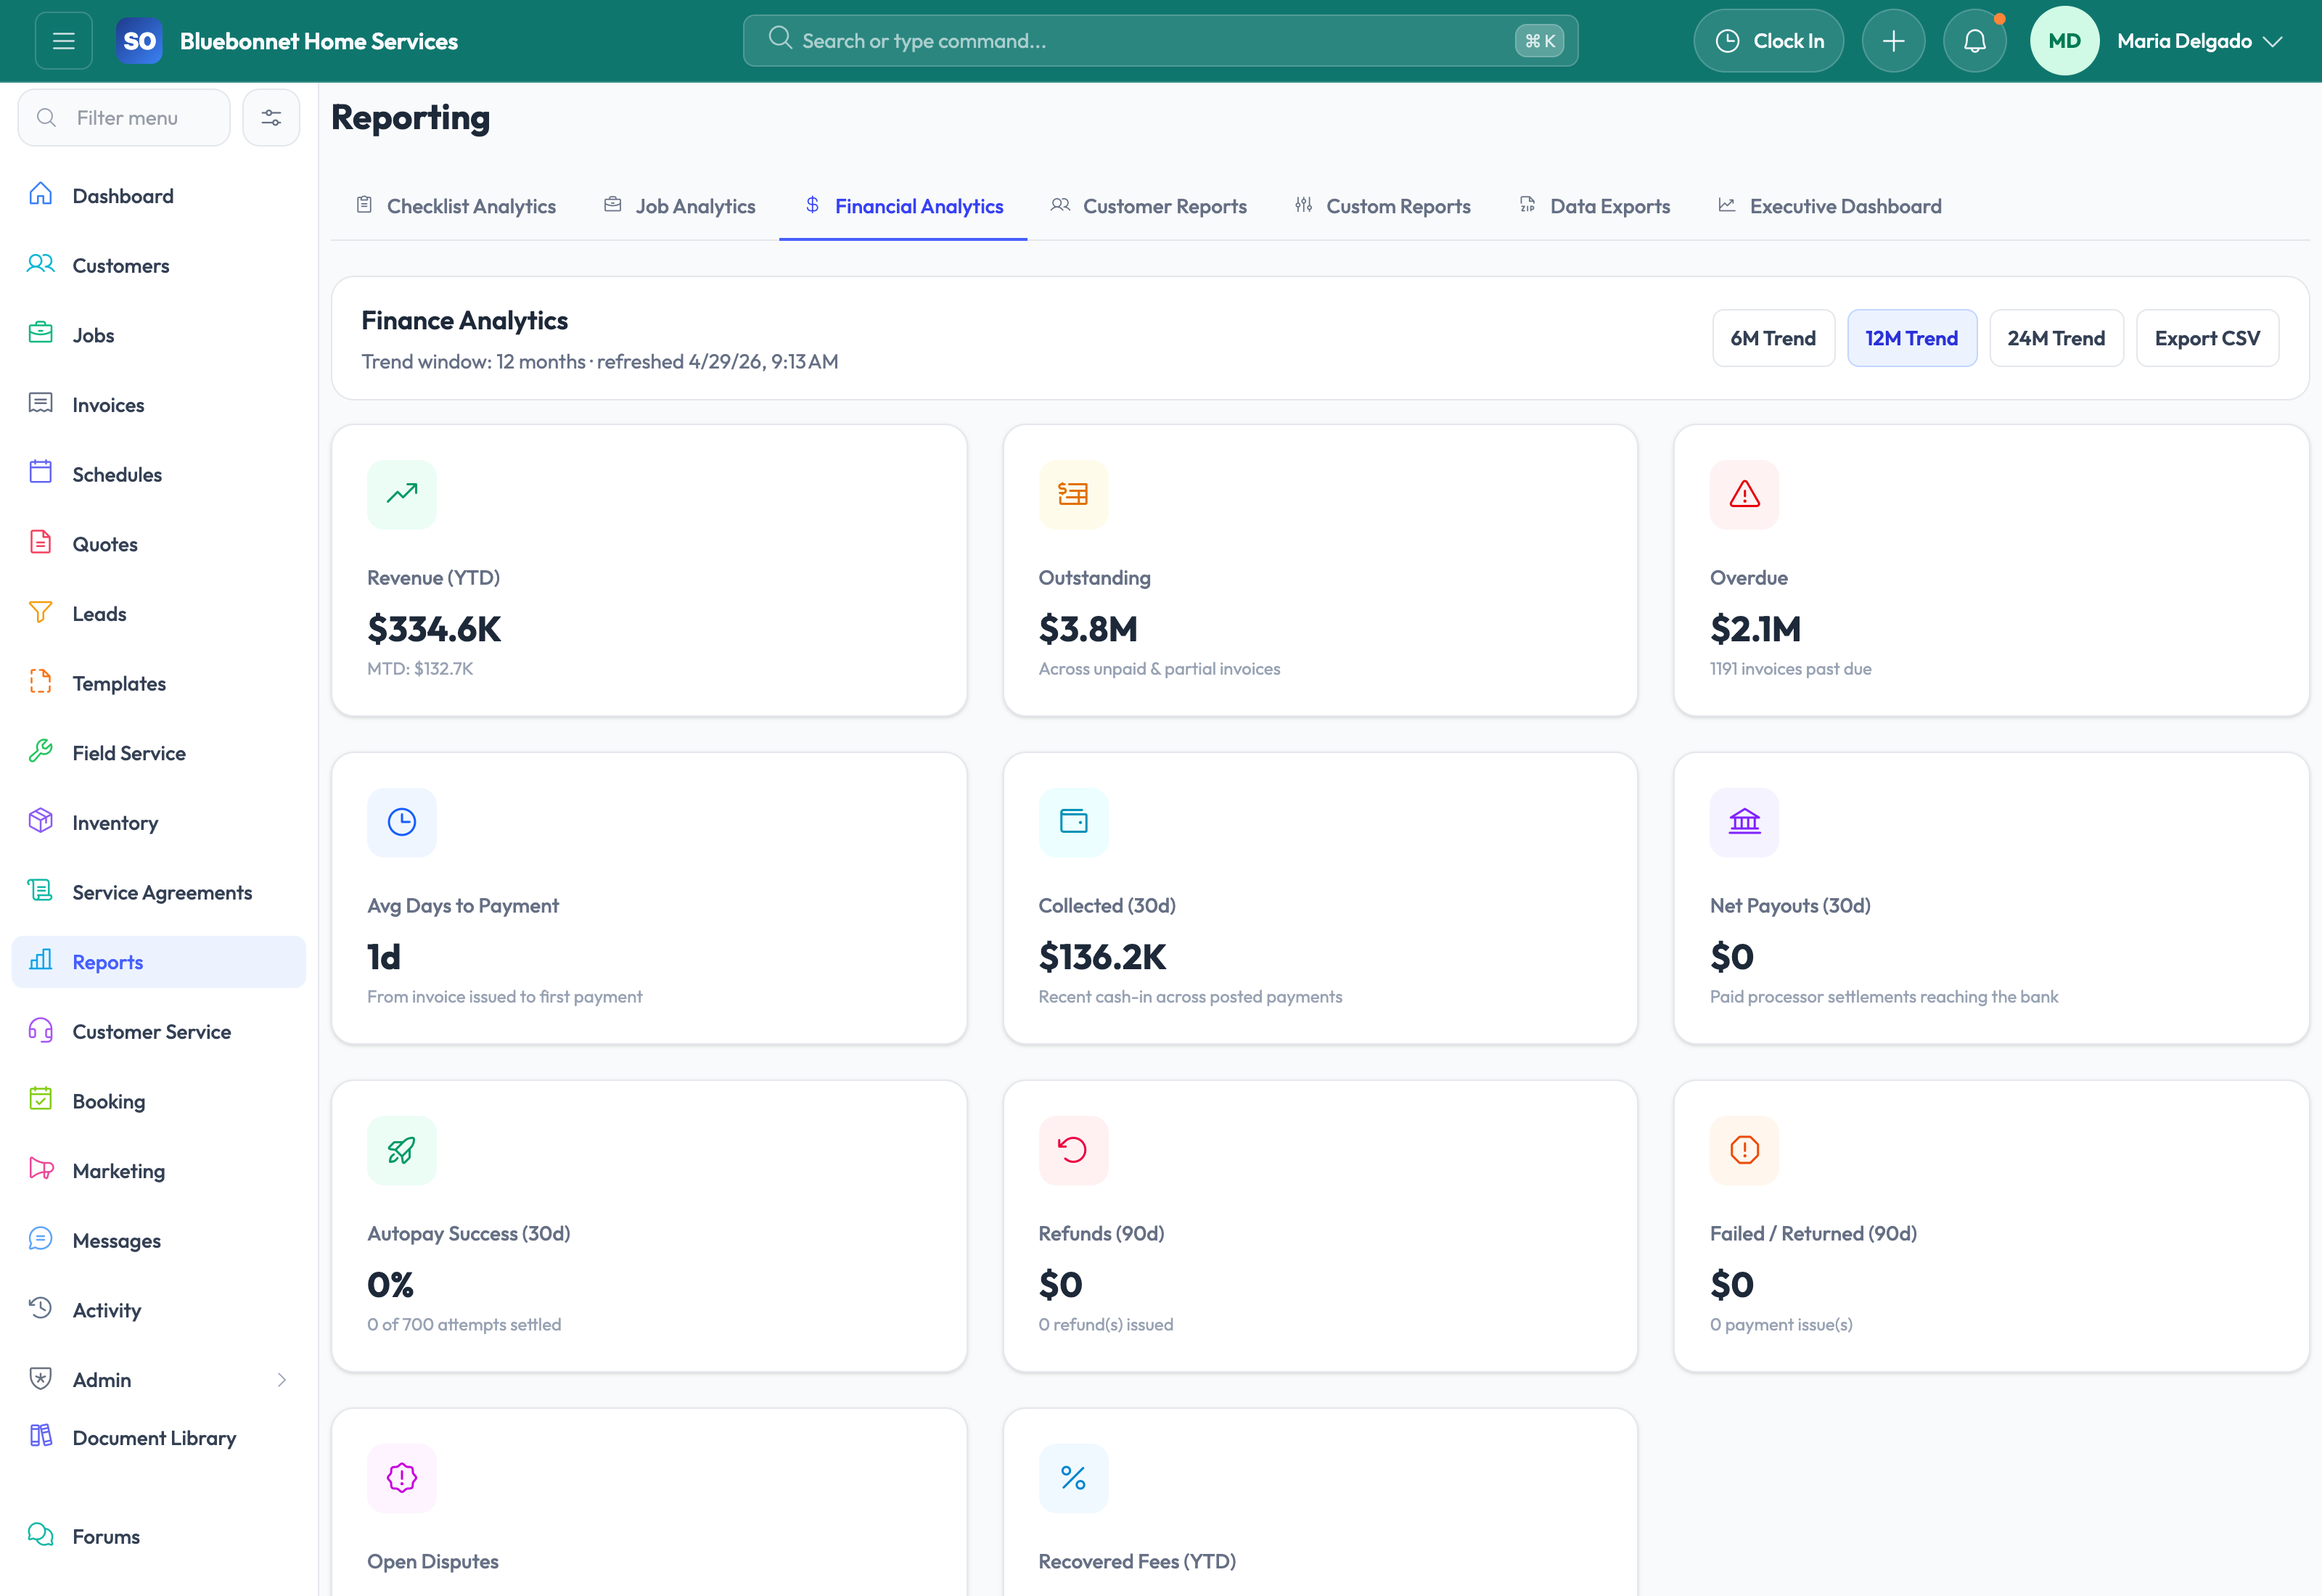
Better financial visibility: Revenue, aging, stock value, and labor usage should be visible before they create surprises.
Faster course correction: Reporting should help catch issues while they are still fixable, not just explain them after the fact.
How Service Opus Helps
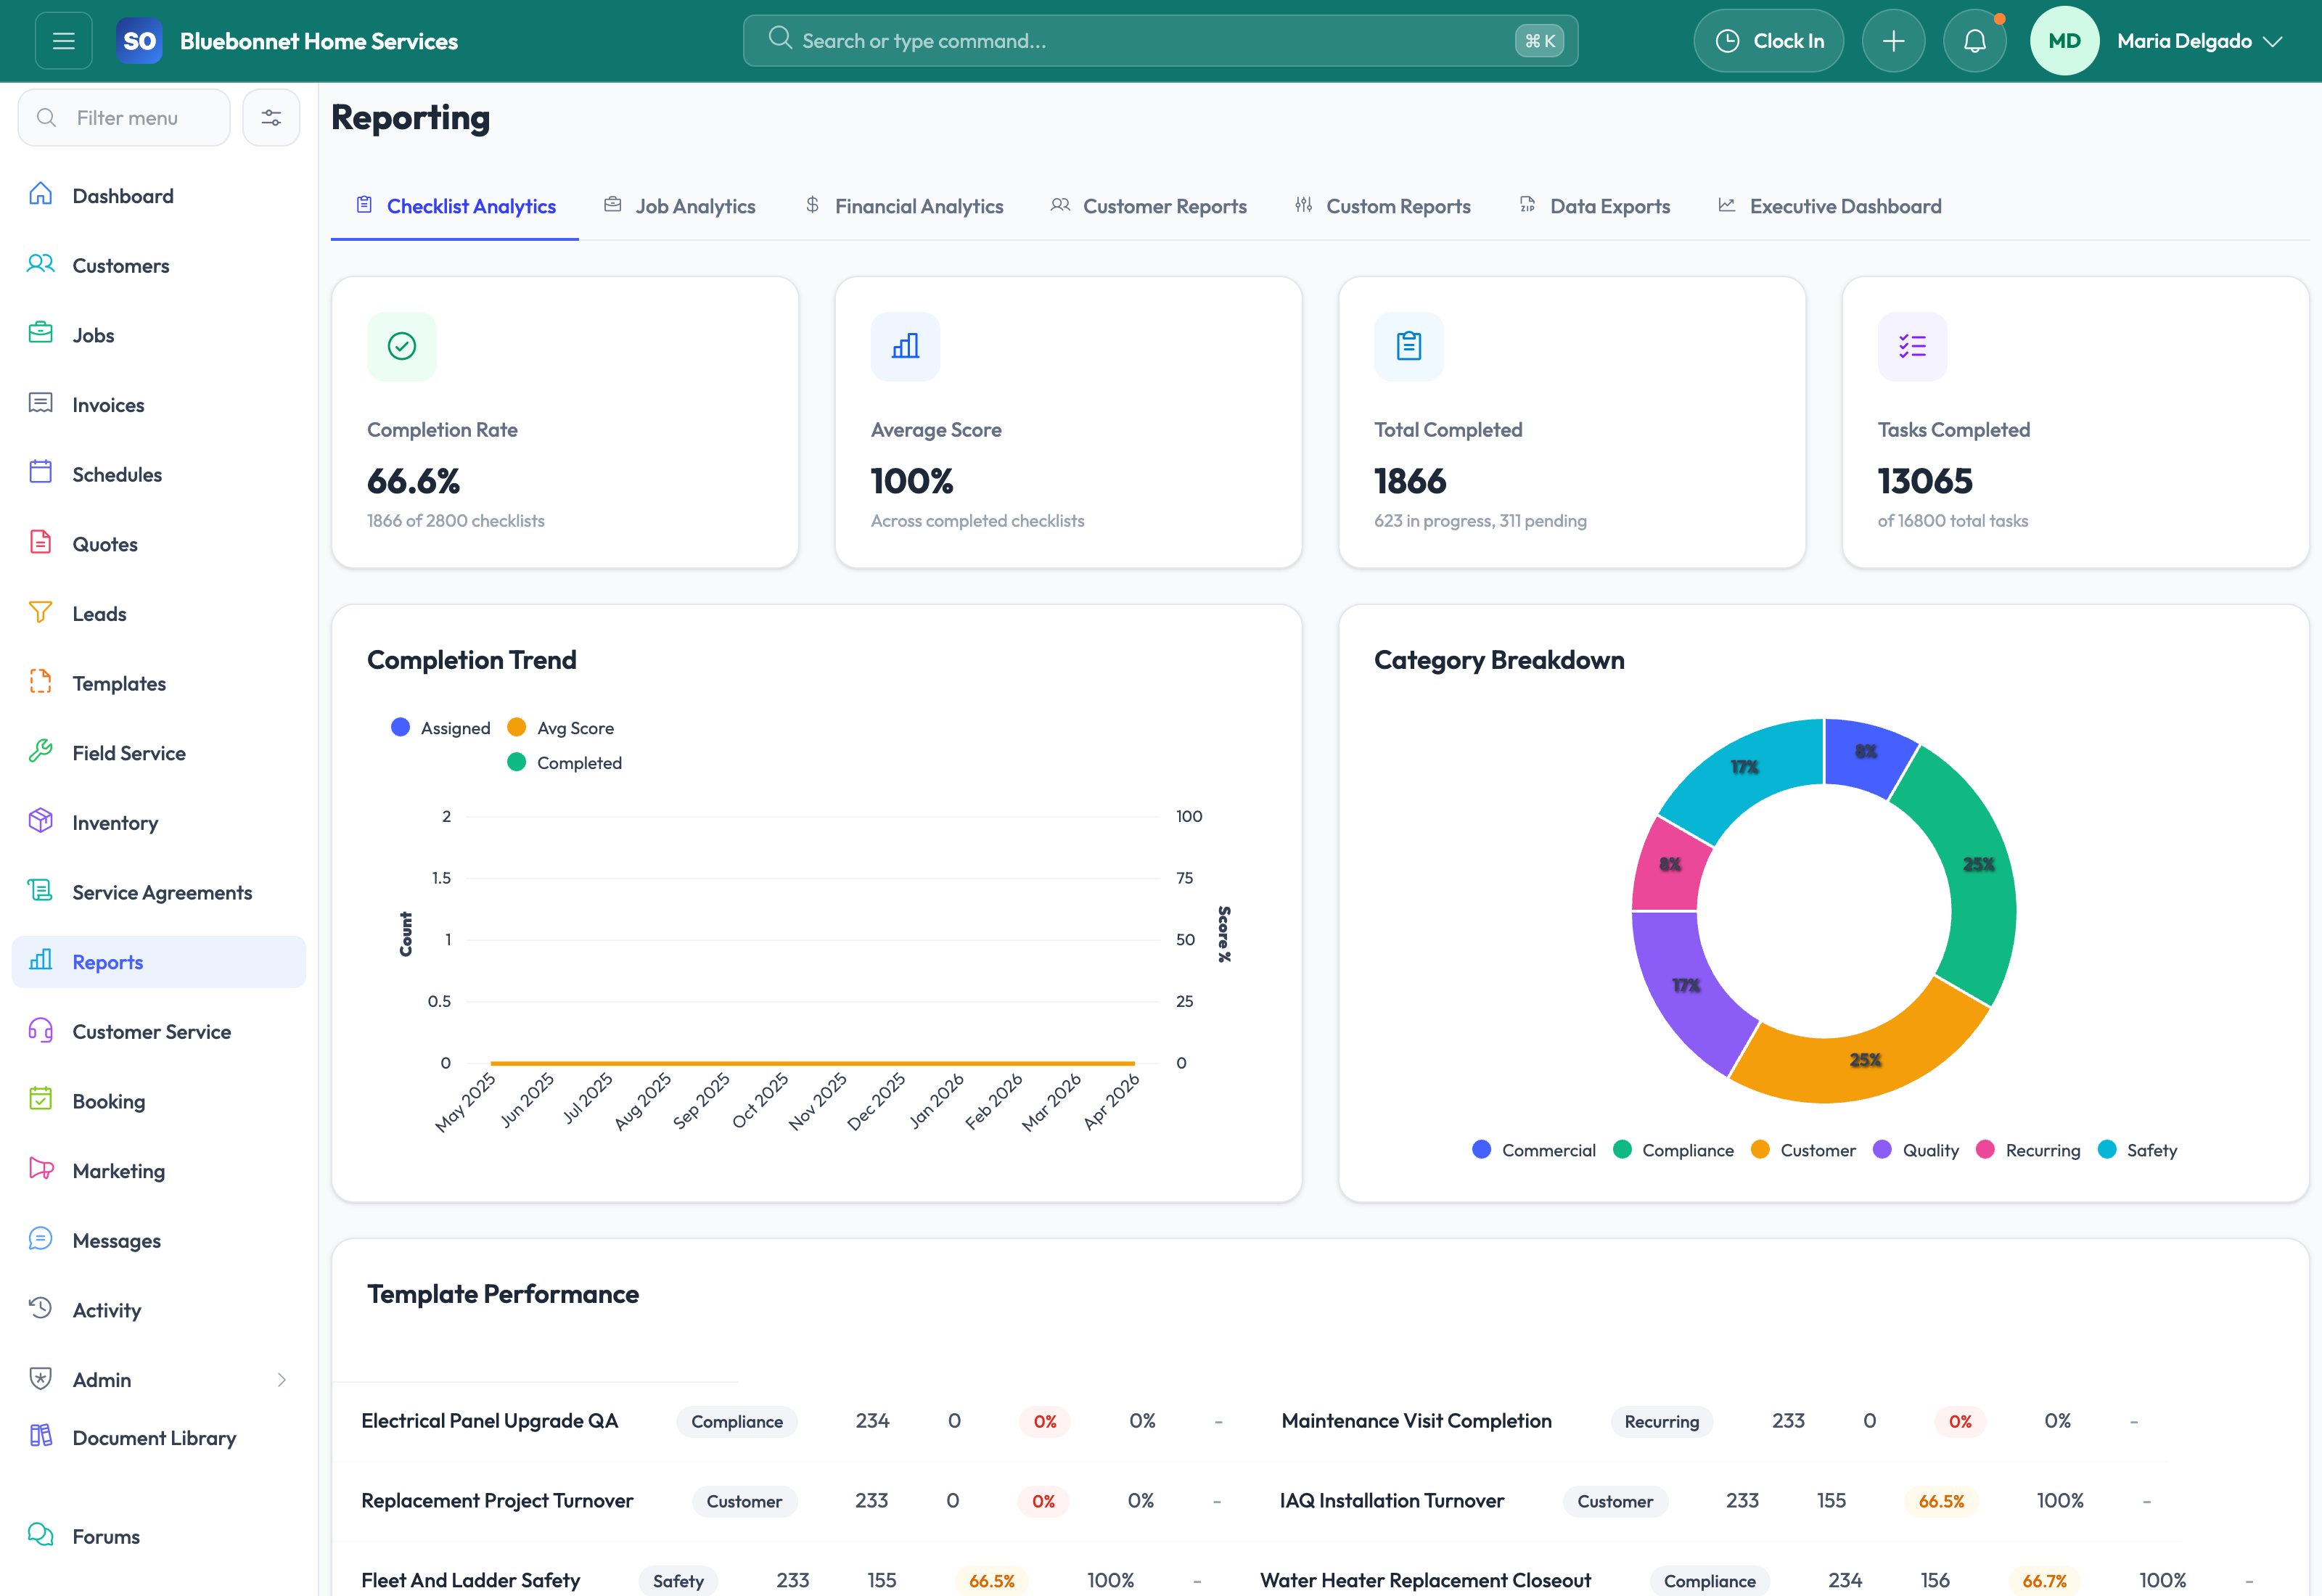
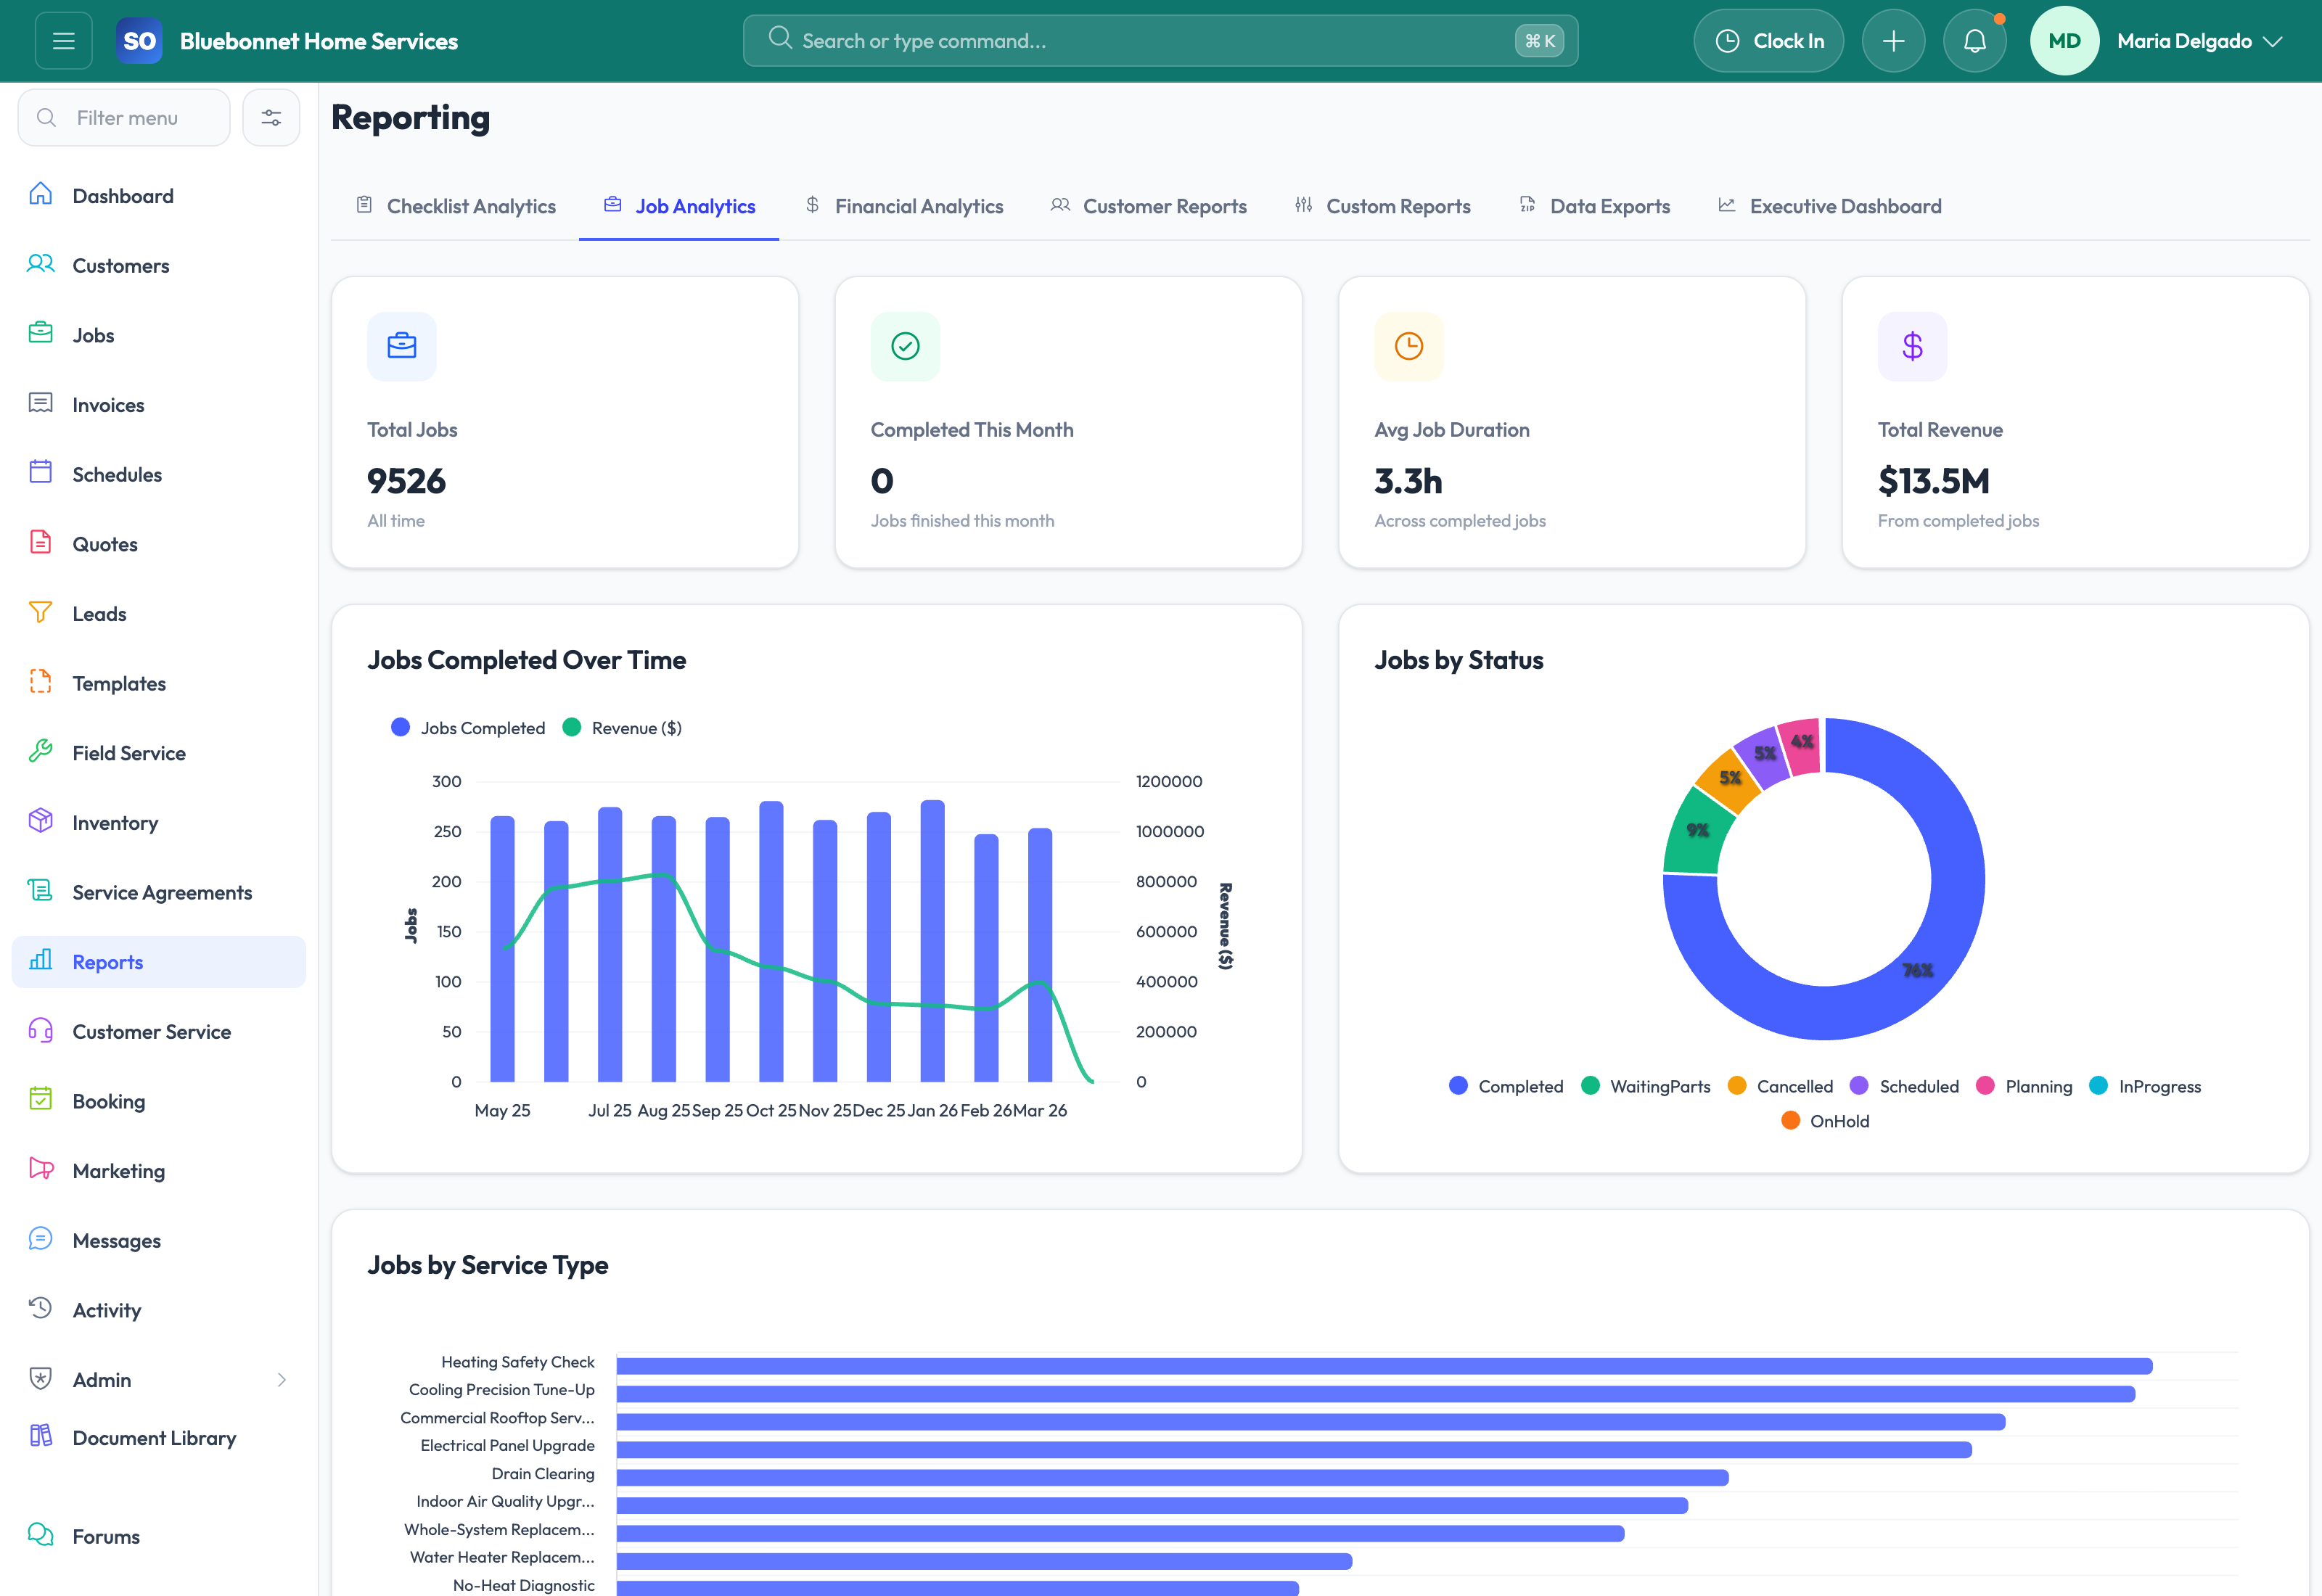
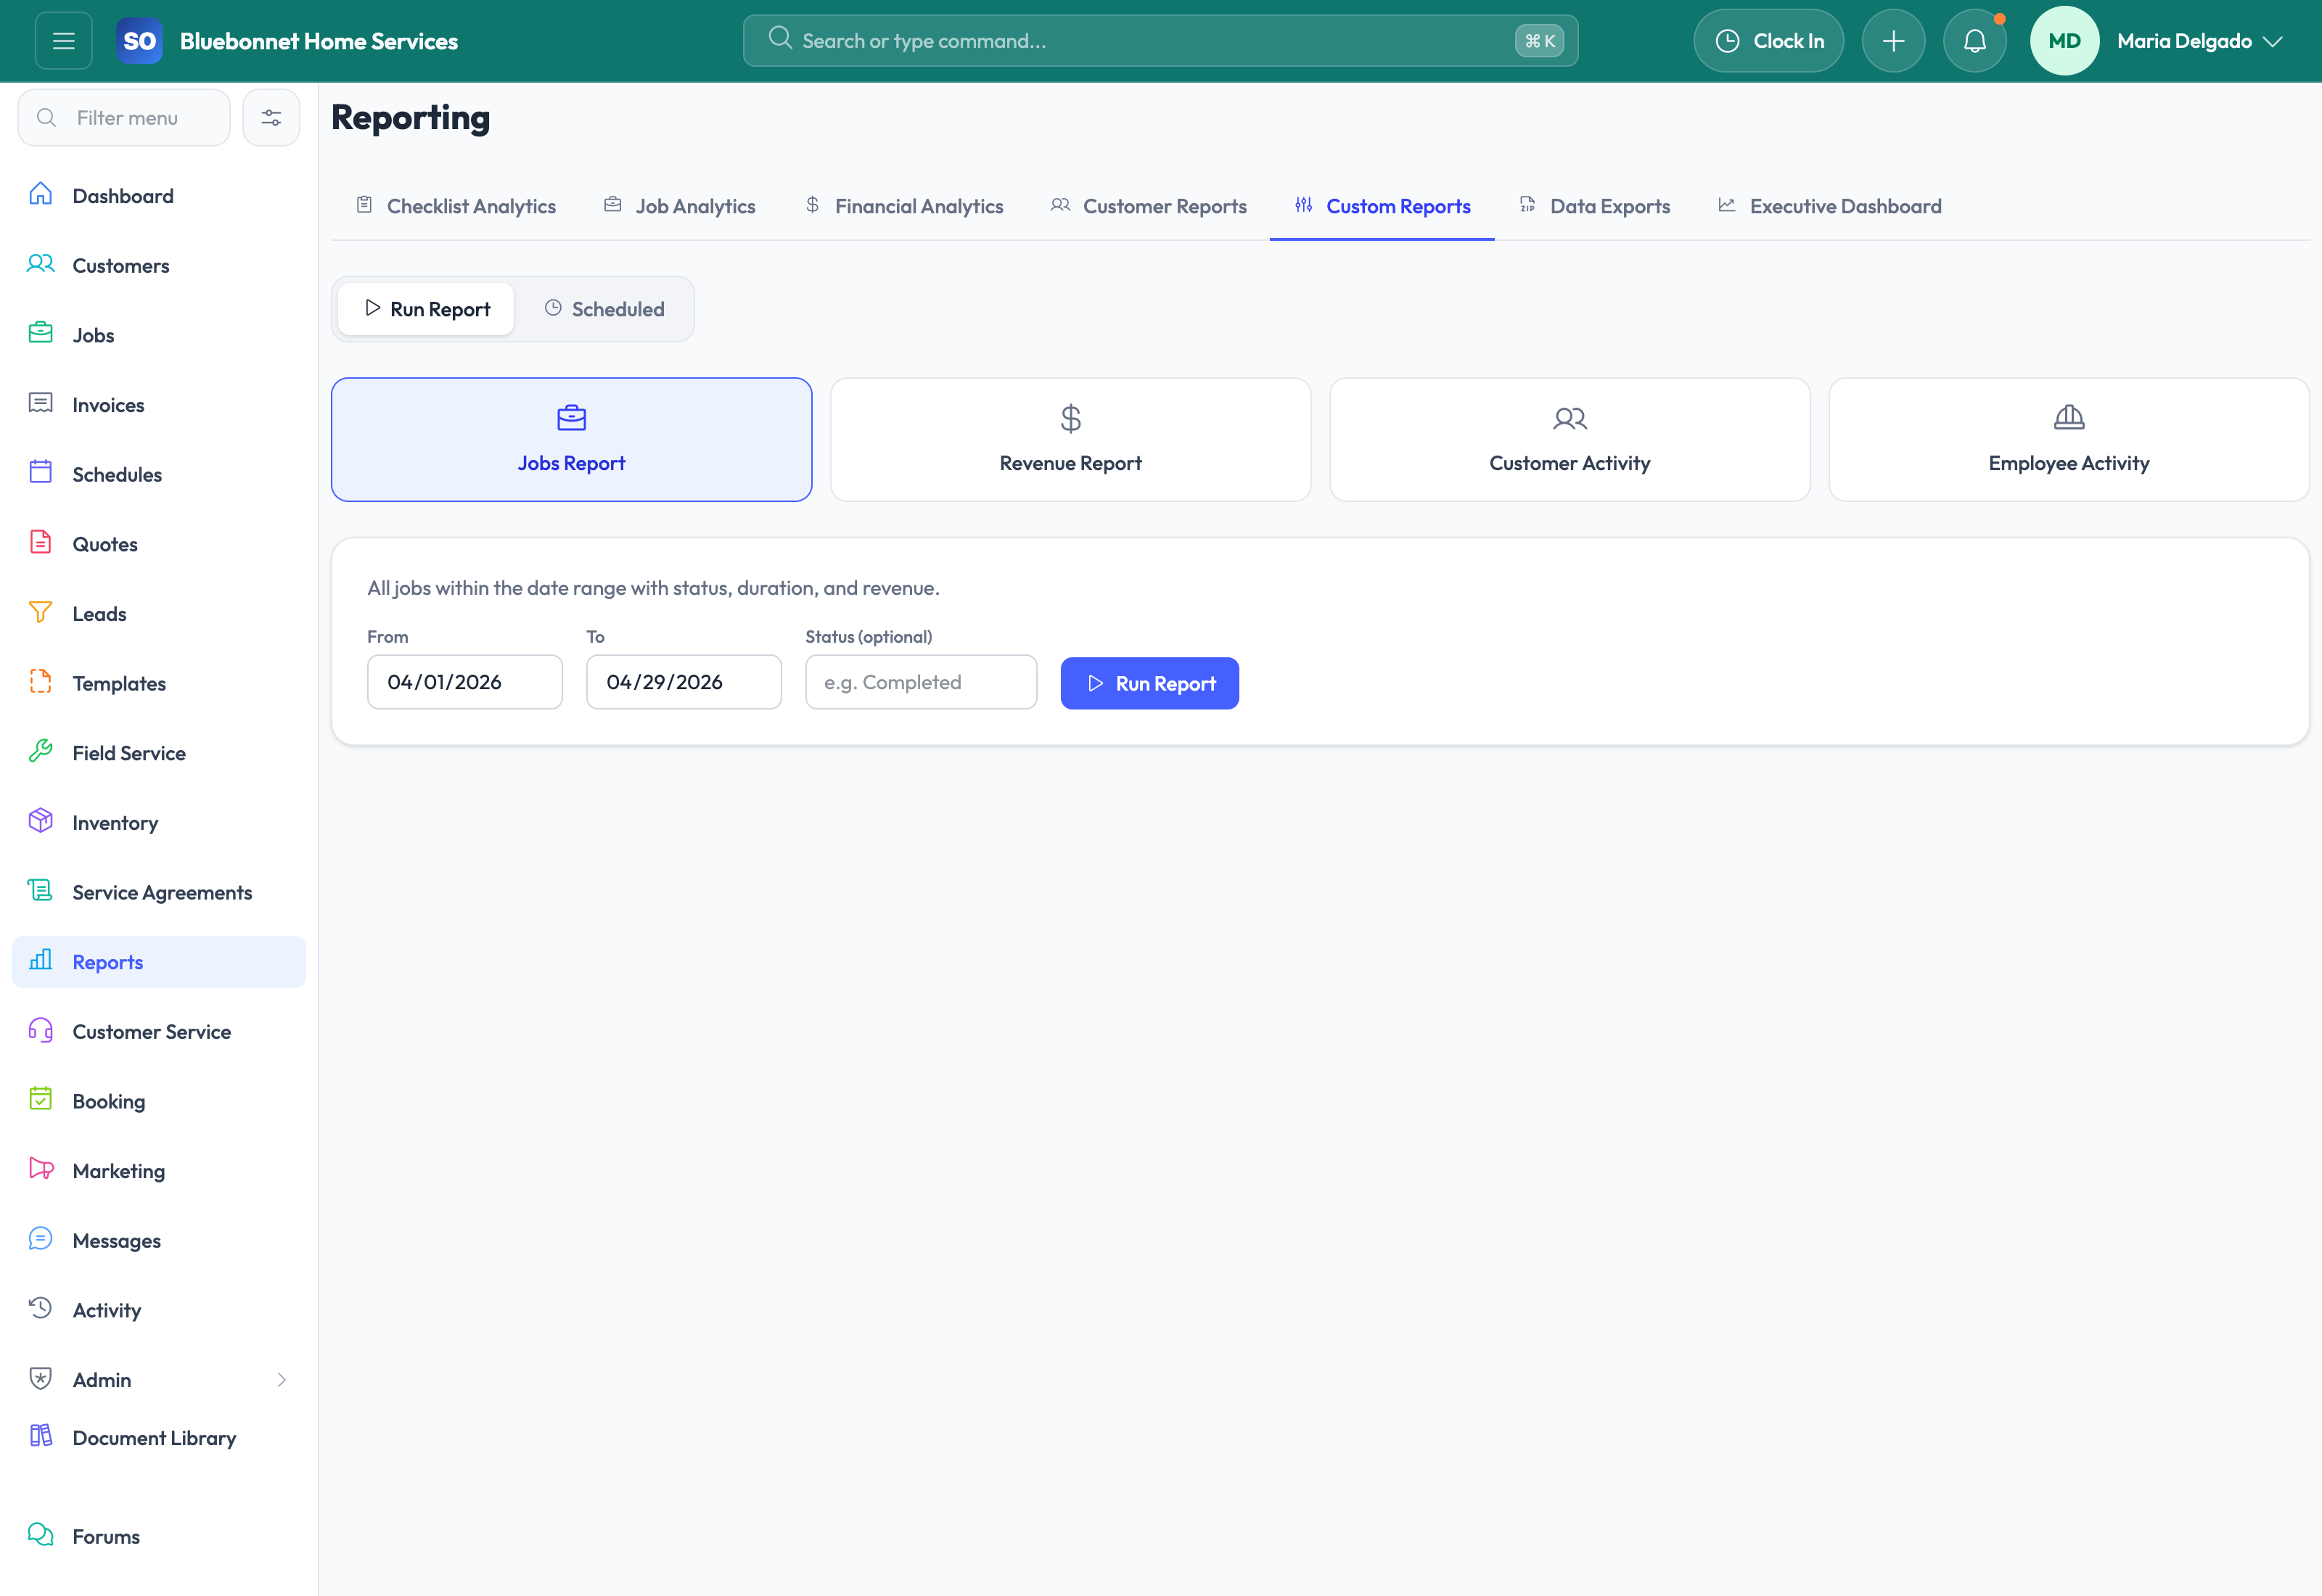
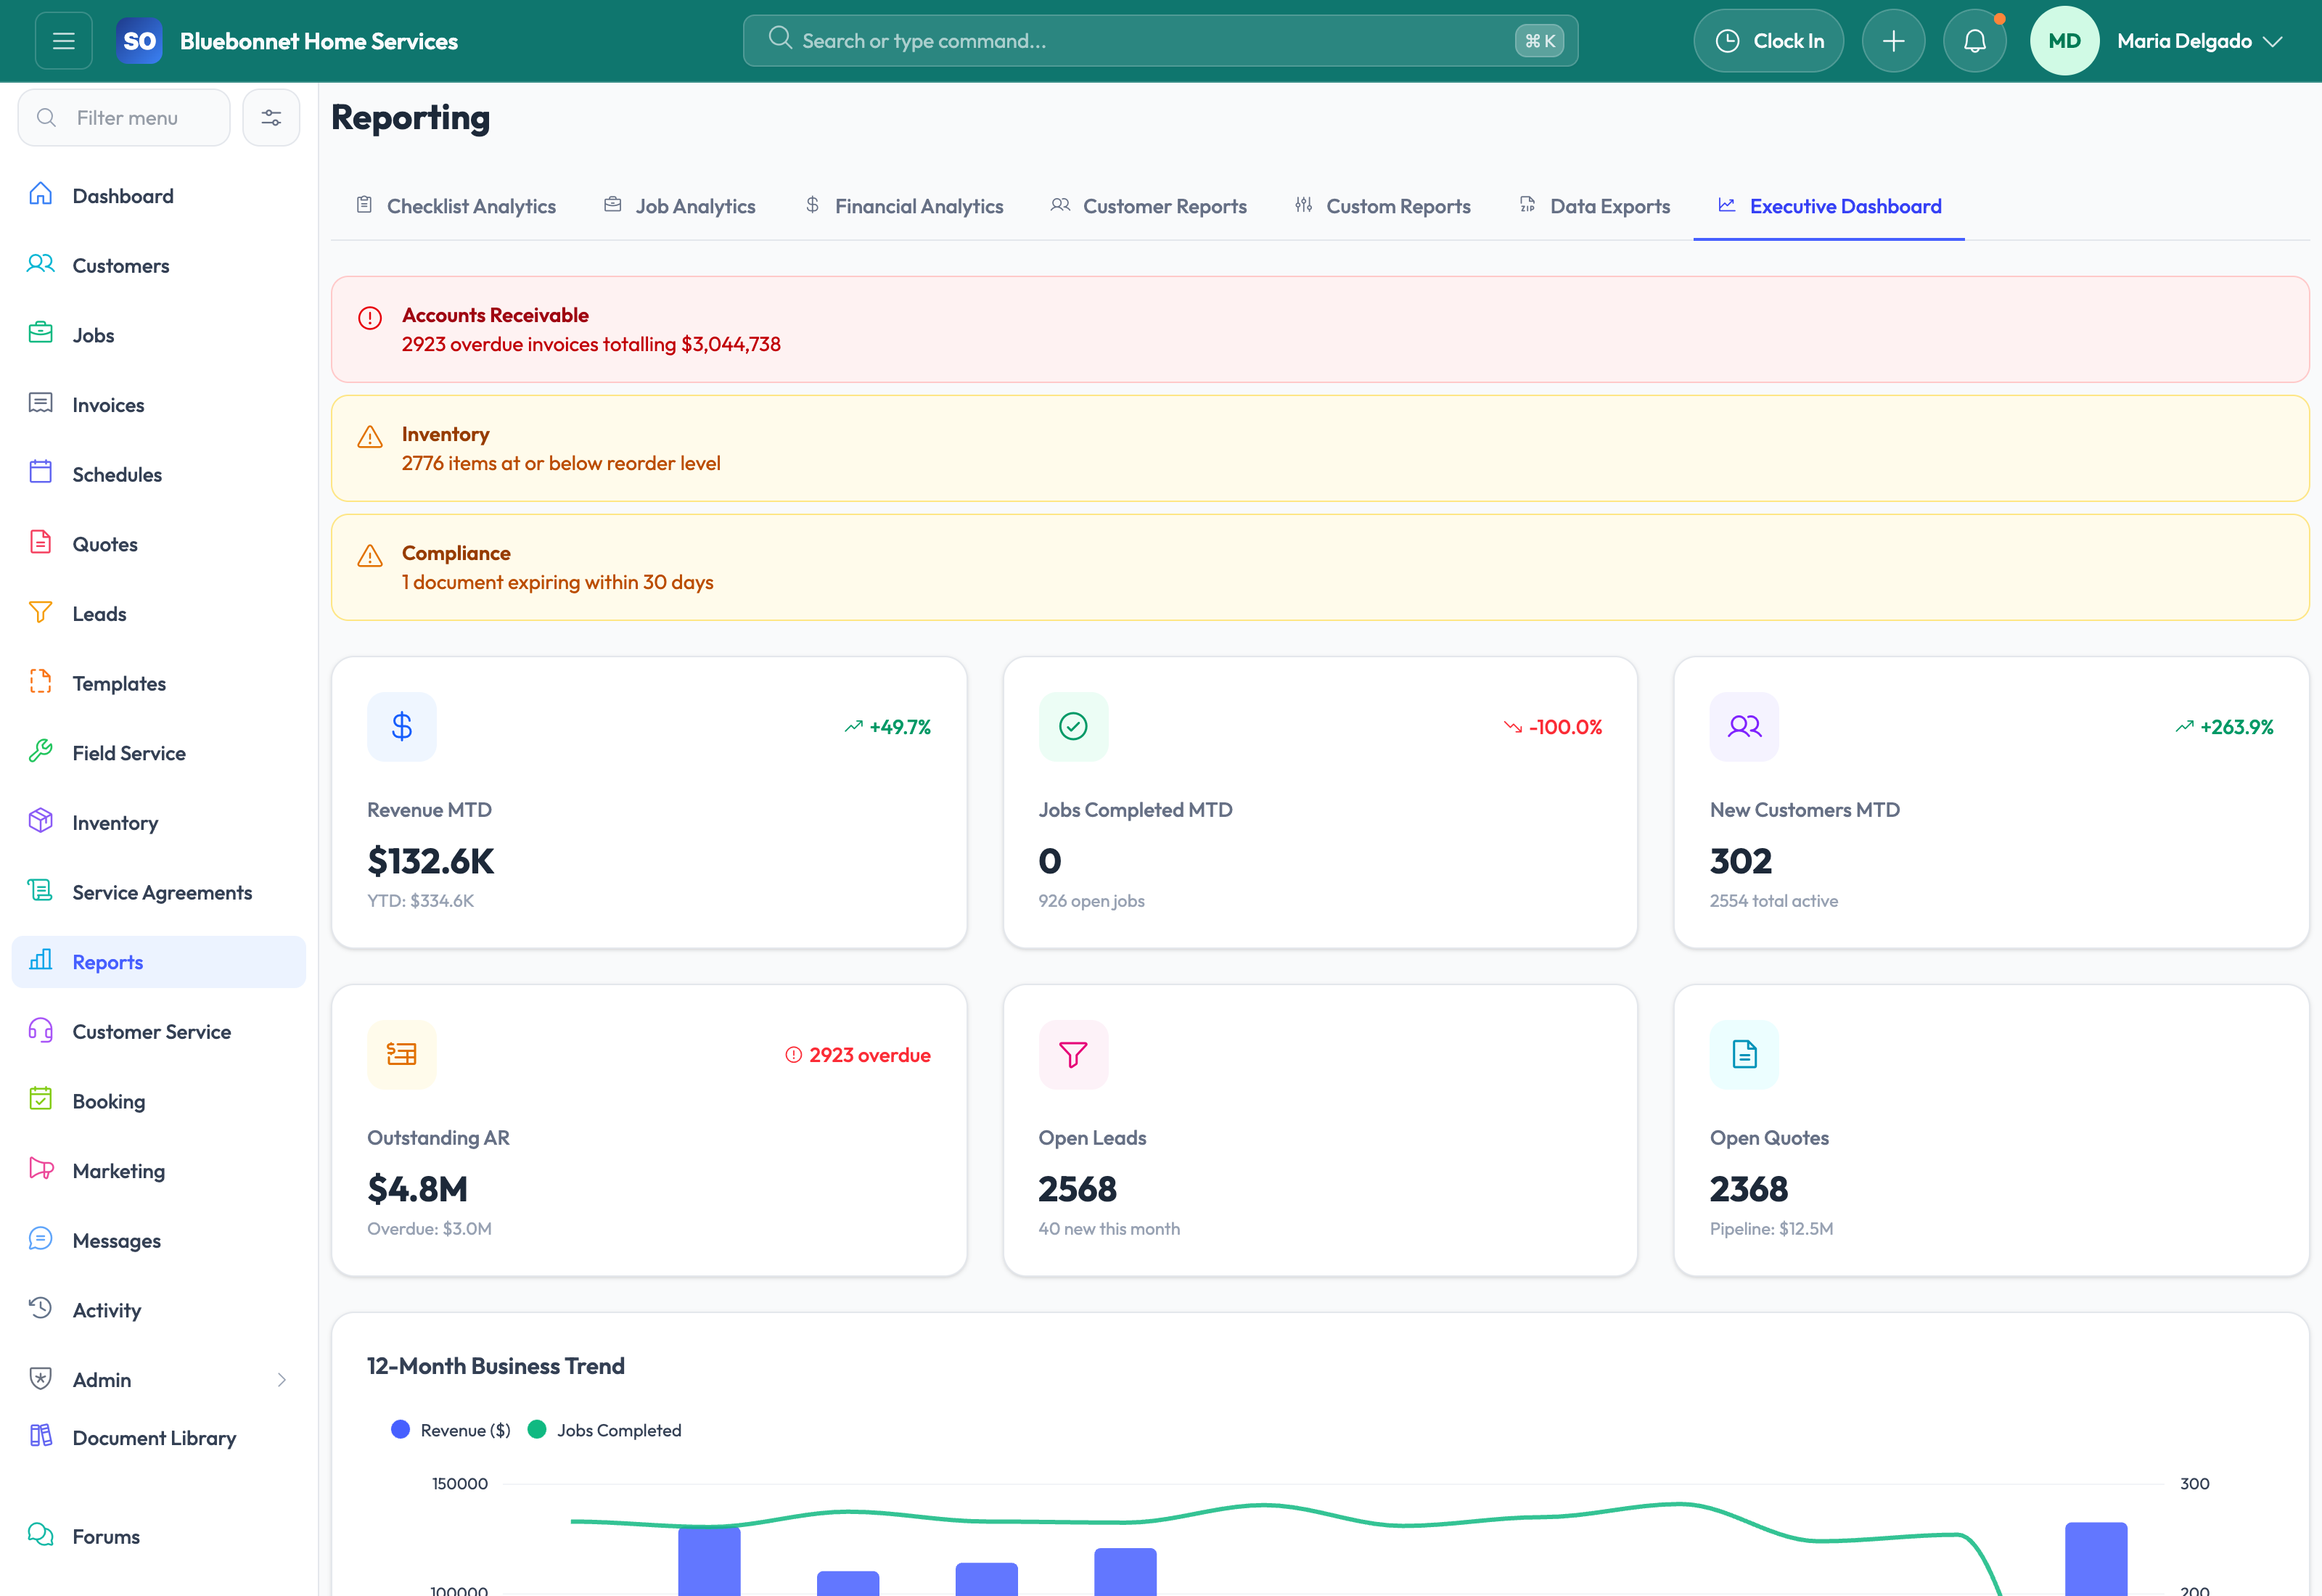
Main operational dashboard: Start with high-level counts and daily visibility across jobs, schedules, invoices, and leads.
Sales and pipeline analytics: Review lead source performance, pipeline value, quote win rate, aging, close reasons, and rep-level outcomes.
Workforce and schedule analytics: Understand utilization, on-time performance, overtime signals, employee performance, and customer satisfaction trends.
Inventory reporting: Use stock alerts, value summaries, movement history, and forecasting to make better purchasing and readiness decisions.
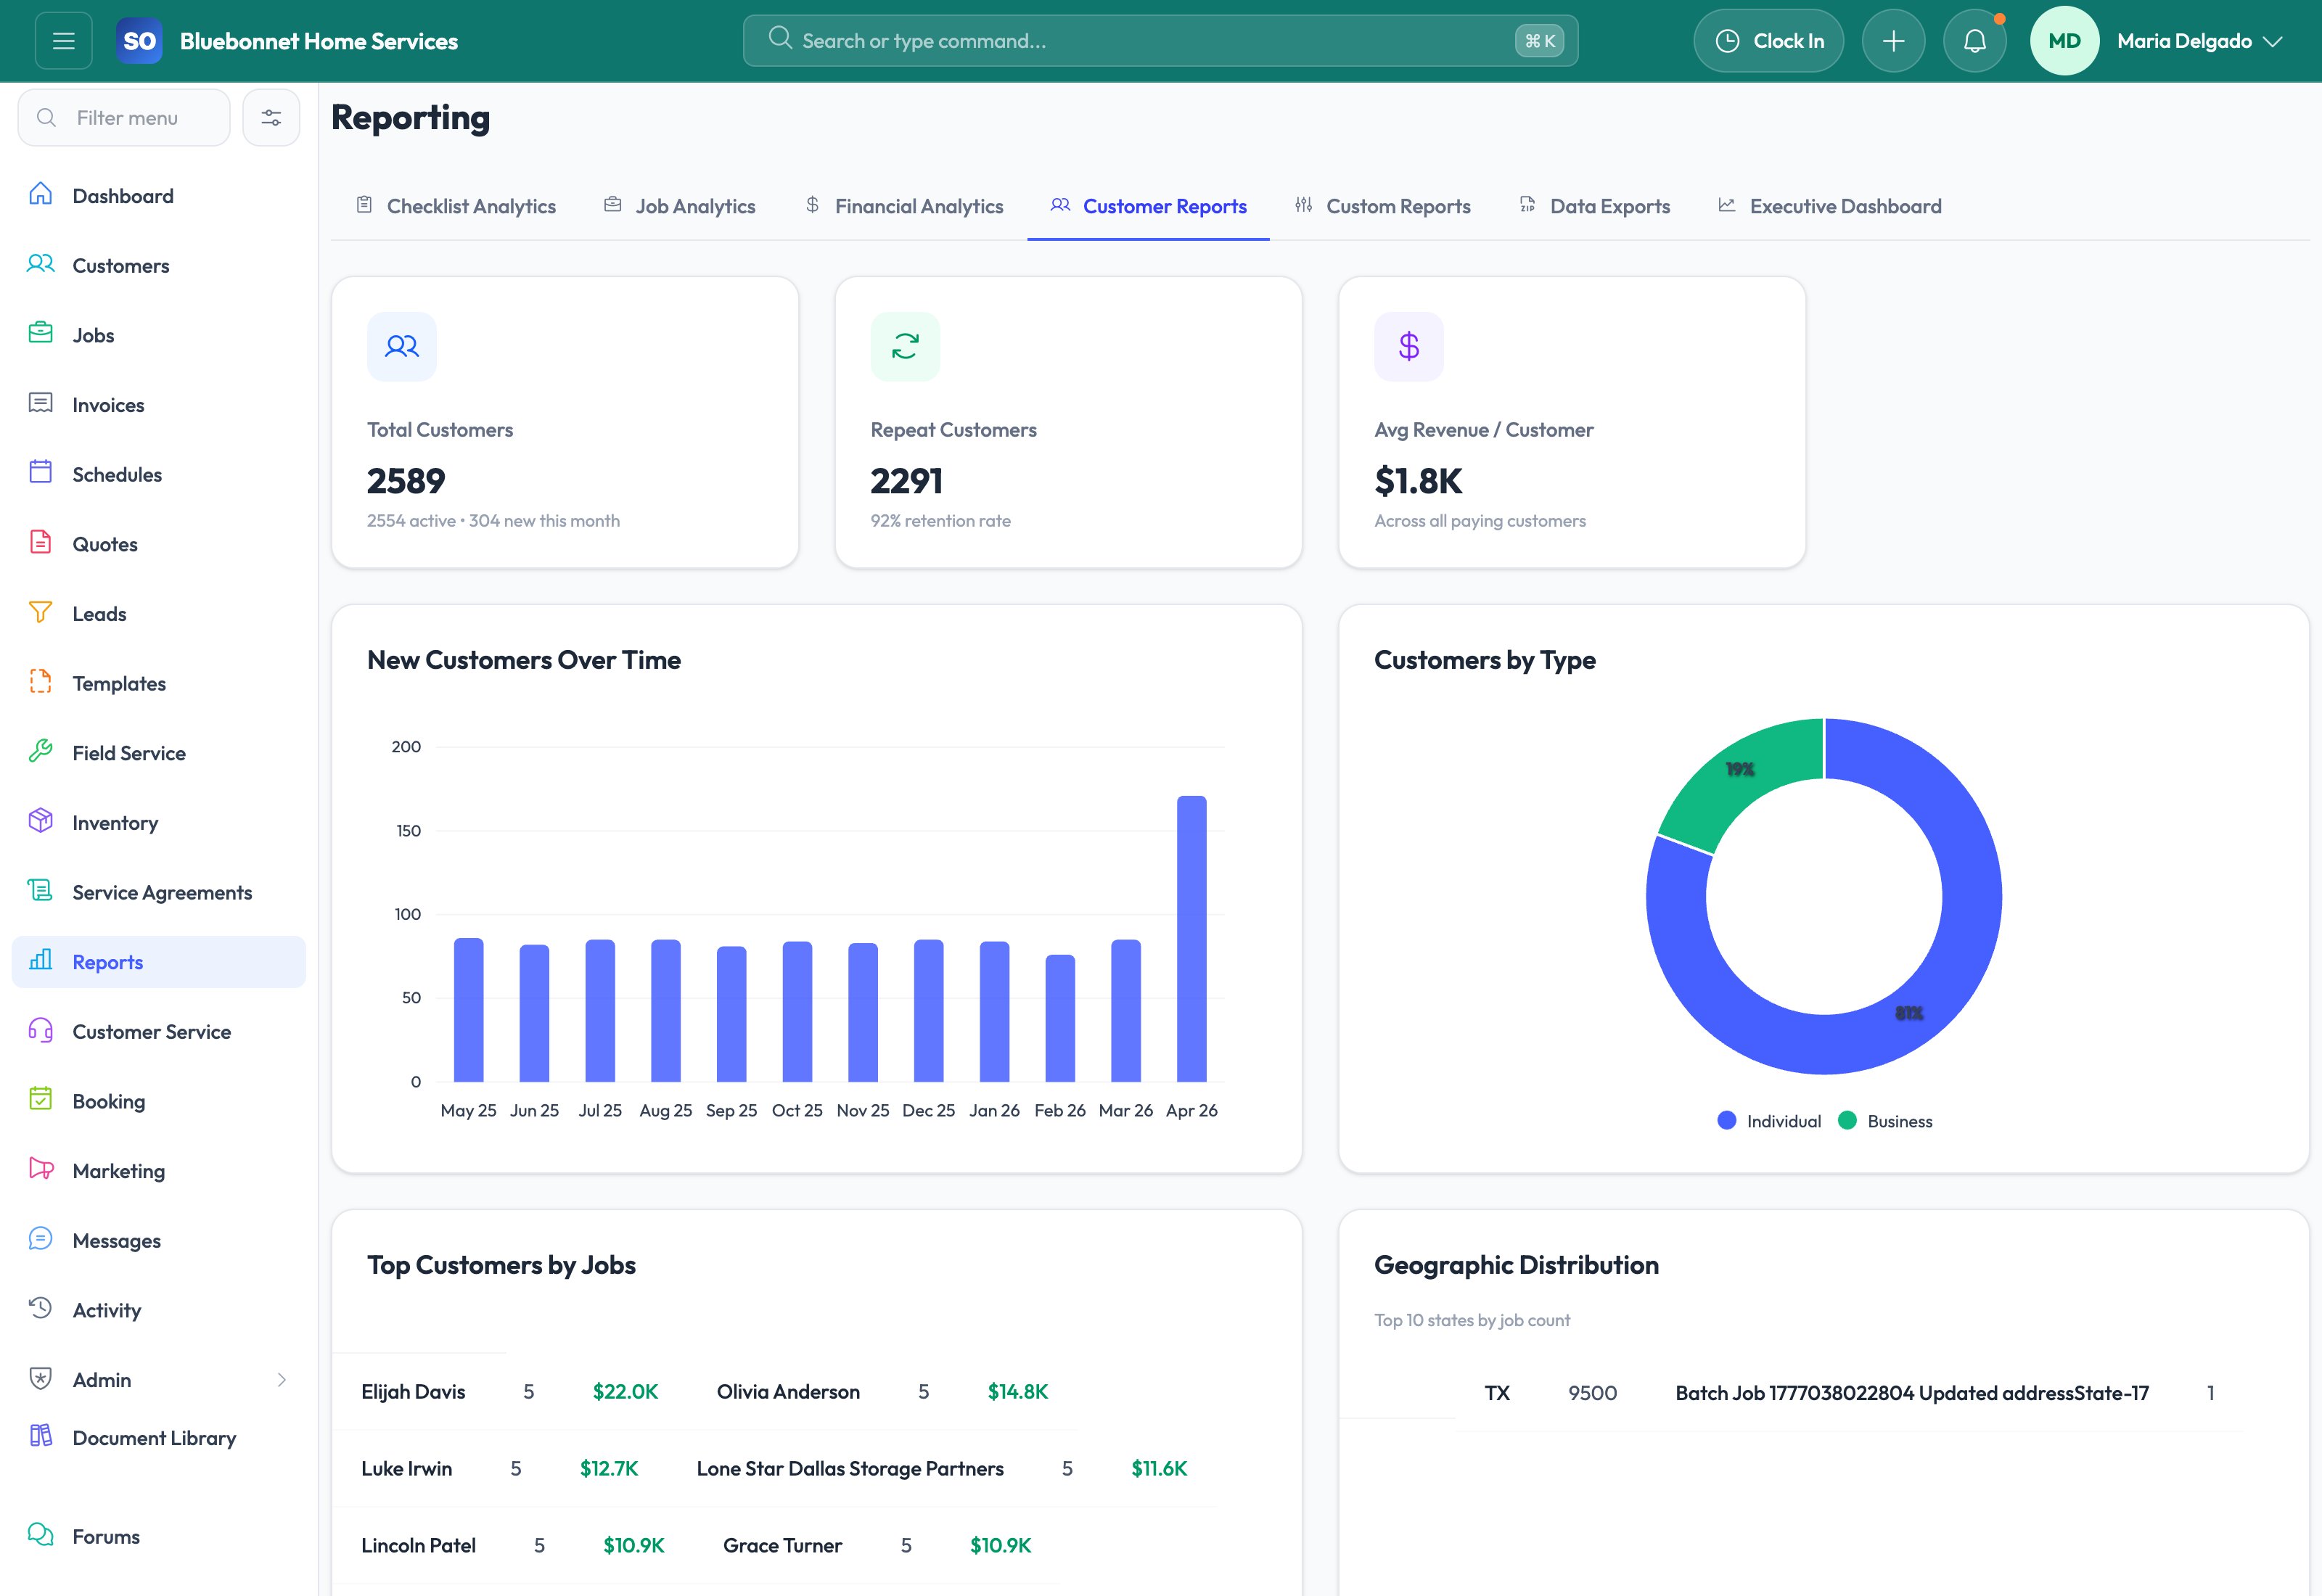
Customer and retention insight: Evaluate customer health, dormant account activity, outstanding balances, and retention-related follow-up opportunities.
Compliance and expiration visibility: Surface expiring documents, certifications, warranties, and related risk indicators in a reportable way.
What Better Reporting Changes
Service Opus helps move reporting from hindsight into operational management. Instead of exporting data from several systems and trying to reconcile it later, managers can use the same platform to see what is happening, why it is happening, and where the next improvement opportunity is likely to be.
Best use: Review reporting as part of your weekly operating cadence, not just month-end. The most value comes when analytics drive scheduling, collections, sales follow-up, and staffing decisions early.
User Guide
Use operational data to measure demand, throughput, cash flow, inventory, labor, and customer health.
Best For
Owners and managers reviewing business performance.
Department leads monitoring pipeline, schedule, billing, and field trends.
Admins building custom reports for recurring decisions.
Before You Start
Define the decisions each report should support before adding metrics.
Confirm source data quality in customers, jobs, invoices, inventory, and time tracking.
Set report access according to financial, employee, and customer sensitivity.
Recommended Workflow
Start with executive dashboards for overall direction.
Drill into job, financial, customer, checklist, or custom reports for root cause.
Filter by date, team, source, status, location, or customer segment.
Compare trends to operational changes such as staffing, marketing, pricing, or workflow updates.
Turn report findings into process changes, assignments, or follow-up reviews.
Review Checklist
Metrics are understood before they are shared as targets.
Reports use consistent date ranges and filters.
Outliers are checked against source records.
Financial and employee data is shared only with appropriate roles.
Common Handoffs
Dashboard for daily action.
Jobs for throughput and completion data.
Invoicing and Payments for cash-flow data.
Customers and Marketing for retention, source, and growth data.
Ready to apply this workflow?
Use the guide to evaluate fit, then start a trial or talk through how Service Opus maps to your team, trade, and current operating process.